
The Education Funding Dashboard summarizes funding and expenditures for K-12 education to inform the public and provide transparency on school district finances in South Carolina. The dashboard allows users to analyze and compare revenues, expenditures, academic achievement, and other data by district.
For more information about the data or sources, please see the definitions and resources below. Questions about a specific district's data should be directed to the district.
Please note that Clarendon and Jasper School Districts have not provided revenue or expenditure data for FY 2022-23 or FY 2023-24.
The dashboard is best viewed on a desktop or laptop computer. See the How to Guide below for tips and tricks on navigating the dashboard.
Title
How to Guide
Zoom out or in (adjust Screen resolution)
Use “Ctrl -” to zoom out and “Ctrl +“ to zoom in
View Full Screen
Use "F11" key or tool button at bottom of screen to change to full screen view

View Each Dashboard Page
Click tabs to change pages
Download pdf of dashboard page
Use tools at bottom of page to download a PDF of the page


Download Data Tables
Use data tables button to download data

Title
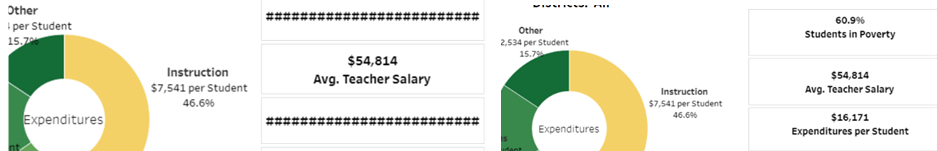
Expenditures
The dashboard uses expenditure data reported to the SC Department of Education by each school district. These audited amounts are published in the Statement of Expenditures and are available for download under the data files section. Expenditure categories are based on In$ite categories. Expenditures for Capital Outlays are excluded from the dashboard.
A file of detailed data and expenditure codes used in the dashboard is available for download under the Data Files section.
Instruction: Costs for teachers, teacher assistants, classroom materials
Instructional Support: Costs for guidance, library & media, extra-curricular, curriculum development, training
Operations: Costs for transportation, food service, building maintenance, business operations
Leadership: Costs for school administration, program management, district administration, legal services
Other: Costs for debt service, retiree benefits, school management contracts, other services (capital outlays are excluded)
Title
Revenues
The dashboard uses revenue data reported to the SC Department of Education by each school district. These audited amounts are published in the Statement of Revenues and are available for download under the data files section. Revenues are grouped by funding source (state, local, or federal) and type. Revenues from Bonds and Leases are excluded.
A file of detailed data and revenue codes used in the dashboard is available for download under the Data Files section.
State K-12 Appropriations: state funding from the State Aid to Classrooms program and other items in the state budget
State Property Tax Reimbursements: state payments to school districts for school property tax exemptions
Local Property & Other Taxes: funds from local property tax, local sales taxes, and other local assessments
Local Fees & Other Charges: school district fees and other local charges
Federal All Sources: all funding received from federal programs
Title
Fund Balance
The figures reported in the dashboard reflect the General Fund Unassigned Balance as of the end of the fiscal year. Each district's fund balance is reported to the SC Department of Education. The fund balance as a percentage of expenditures is calculated using this fund balance compared to total expenditures as reported in the dashboard. This calculation may differ from other fund balance calculations by districts depending on the expenditures used in the calculation. A complete listing by the SC Department of Education is available for download under the Data Files section.
Title
Teachers and Average Salary
The number of teachers and average salary for each district are based on classroom teachers as defined by the SC Department of Education.
The Average Teacher Salary by District report published by the SC Department of Education is available for download under the Data Files section.
Title
Student-Teacher Ratio
Student-teacher ratio in the dashboard is based on the number of students per classroom teacher (see Teachers and Average Salary). The student-teacher ratios presented in the Aid to Classrooms section are based on a student-teacher ratio that includes all instructional personnel (not just classroom teachers). These ratios will differ.
Title
Aid to Classrooms
Aid to Classrooms is the state budget appropriation that provides funding to education based on a statewide average student-teacher ratio. More information is available here: Education Funding Reform.
Funding in this category is based on the number of teachers needed to serve the estimated number of students (measured using average daily membership or ADM) based on a prescribed student-teacher ratio.
This section of the dashboard is based on FY 2022-23, FY 2023-24, and FY 2024-25 actual payments for the first three years of the Aid to Classrooms formula. All other sections of the dashboard are based on FY 2020-21, FY 2021-22, FY 2022-23, and FY 2023-24 actual revenue and expenditure data.
Student-teacher Ratio (All Instructional Personnel)
- The target student-teacher ratio in the FY 2024-25 Budget was 11.2 statewide. The formula ratio with final funding was 11.2.
- Total student count determines the number of teachers to be funded.
- The student-teacher ratio in each district will vary depending on its students and their needs.
- The ratios reported include all instructional personnel. Instructional positions include the following SC Educator position codes: special education – itinerant (03), kindergarten (05), special education – self-contained (06), special education – resource (07), classroom teacher (08), retired teachers (09), library/media specialists (10), guidance counselors (11), speech therapists (17), school nurses (36), occupational/physical therapists (37), orientation/mobility instructors (38), audiologists (39), social workers (40), purchased service teachers (46), and psychologists (85). Please note that prekindergarten (04) positions are not included.
- Formula ratio is the number of instructional positions funded per student at the total teacher cost through the Aid to Classrooms formula.
- Funded ratio is total instructional positions per student that can be funded with the total Aid to Classrooms formula funding and state proportional funding.
- Actual ratio is total instructional positions per student employed by the district.
(See Student-teacher Ratio section for more information about how the ratios differ for classroom teachers and Aid to Classrooms.)
Cost of a Teacher
- The cost of a teacher is defined as the state minimum salary cost of a teacher with a master’s degree and 12 years of experience and fringe benefits, which also reflects the average education and experience level of teachers.
Title
Students Meeting or Exceeding Expectations in ELA and Math
The percentage of students meeting or exceeding expectations in English Language Arts (ELA) and math is based on report card data. Percentages for districts that consolidated after publication of the report card data are calculated by SC RFA from the reported student counts. The report card data are available for download here.
Title
Data Files and Resources
Data reported in the dashboard can be downloaded directly from the data tables option on each tab of the dashboard. The following downloadable files provide detailed source reports and code listings from the SC Department of Education used in the dashboard.
FY 2020-21 Education Dashboard Resources
FY 2021-22 Education Dashboard Resources